Women in Parliament Worldwide
This week’s RWeekly digest included an awesome dataset from the World Bank that documents the percentage of women in lower house parliament across the globe from 1997 to 2018. The dataset is nearly complete and also includes summary statistics for numerous geographic aggregations.
All of my code to process and explore the data is available on my GitHub. There’s lots of interesting things to look at in this data, so I will leave most of the boring stuff out of this post.
To get a sense of the World Bank data, here are the top 10 and bottom 10 countries in 2018 in terms of percentage of parliament made up of women.
wip %>%
  filter(year == 2018) %>%
  top_n(n = 10, wt = prop_women_seats) %>%
  arrange(desc(prop_women_seats)) %>%
knitr::kable(caption = "Top 10 Countries with the largest proportion of women in their parliament in 2018")| country_name | country_code | year | prop_women_seats |
|---|---|---|---|
| Rwanda | RWA | 2018 | 61.3 |
| Cuba | CUB | 2018 | 53.2 |
| Bolivia | BOL | 2018 | 53.1 |
| Mexico | MEX | 2018 | 48.2 |
| Grenada | GRD | 2018 | 46.7 |
| Namibia | NAM | 2018 | 46.2 |
| Sweden | SWE | 2018 | 46.1 |
| Nicaragua | NIC | 2018 | 45.7 |
| Costa Rica | CRI | 2018 | 45.6 |
| South Africa | ZAF | 2018 | 42.3 |
wip %>%
  filter(year == 2018) %>%
  top_n(n = 10, wt = -prop_women_seats) %>%
  arrange(prop_women_seats) %>%
knitr::kable(caption = "Bottom 10 Countries with the smallest proportion of women in their parliament in 2018")| country_name | country_code | year | prop_women_seats |
|---|---|---|---|
| Micronesia, Fed. Sts. | FSM | 2018 | 0.0 |
| Papua New Guinea | PNG | 2018 | 0.0 |
| Vanuatu | VUT | 2018 | 0.0 |
| Yemen, Rep. | YEM | 2018 | 0.0 |
| Oman | OMN | 2018 | 1.2 |
| Haiti | HTI | 2018 | 2.5 |
| Kuwait | KWT | 2018 | 3.1 |
| Solomon Islands | SLB | 2018 | 4.0 |
| Lebanon | LBN | 2018 | 4.7 |
| Thailand | THA | 2018 | 5.3 |
Only 3 countries had over half women in their parliament in 2018! The top 10 are still all over 40%, which seems encouraging! Less encouragingly, four nations still had 0 women in the lower house of parliament in 2018.
Global Trends in Female Representation
Conveniently, the dataset has a precalculated global aggregate statistic.
wip %>%
  filter(country_name == "World") %>%
  ggplot(aes(year, prop_women_seats)) +
  geom_point() +
  geom_line() +
  scale_x_continuous(
    breaks = seq(1998, 2018, by = 2),
    minor_breaks = FALSE
  ) +
  scale_y_continuous(labels = scales::percent_format(accuracy = 1, scale = 1)) +
  theme_minimal() +
  labs(
    title = "There has been a constant upward trend globally since 1997",
    x = NULL,
    y = "Percentage of parliament seats held by women"
  )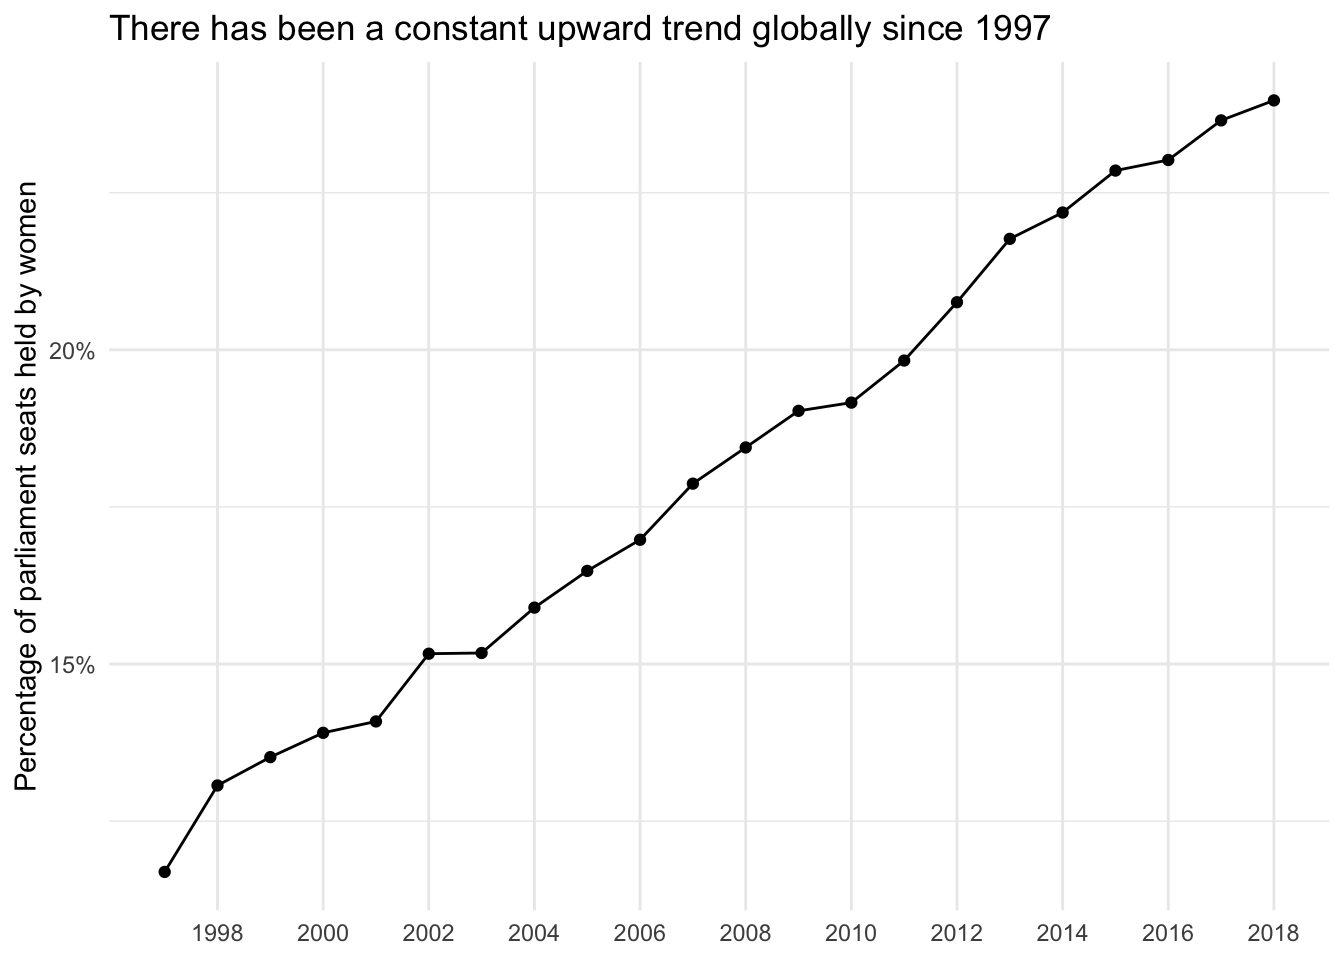
It is encouraging to see that female representation has increased every year when we look at the whole world aggregated.
By region
regions <- c(
  "East Asia & Pacific",
  "Europe & Central Asia",
  "Latin America & Caribbean",
  "Middle East & North Africa",
  "Sub-Saharan Africa",
  "North America",
  "South Asia"
)

wip %>%
  filter(country_name %in% regions) %>%
  drop_na(prop_women_seats) %>%
  ggplot(aes(year, prop_women_seats, color = country_name)) +
  geom_line(size = 1) +
  geom_point(size = 1) +
  ggrepel::geom_text_repel(
    aes(label = country_name),
    data = . %>% group_by(country_name) %>% top_n(1, wt = year),
    nudge_x = 0.25,
    direction = "y",
    hjust = 0
  ) +
  scale_x_continuous(
    breaks = seq(1998, 2018, 2),
    minor_breaks = NULL,
    limits = c(1997, 2028)
  ) +
  scale_y_continuous(labels = scales::percent_format(accuracy = 1, scale = 1)) +
  guides(color = "none") +
  theme_minimal() +
  labs(
    x = NULL,
    y = "Percentage of parliament seats held by women",
    title = "All regions but South Asia have had increasing representation since 1997",
    subtitle = "Latin America & Caribbean and Middle East & North Africa have seen large incerases"
  )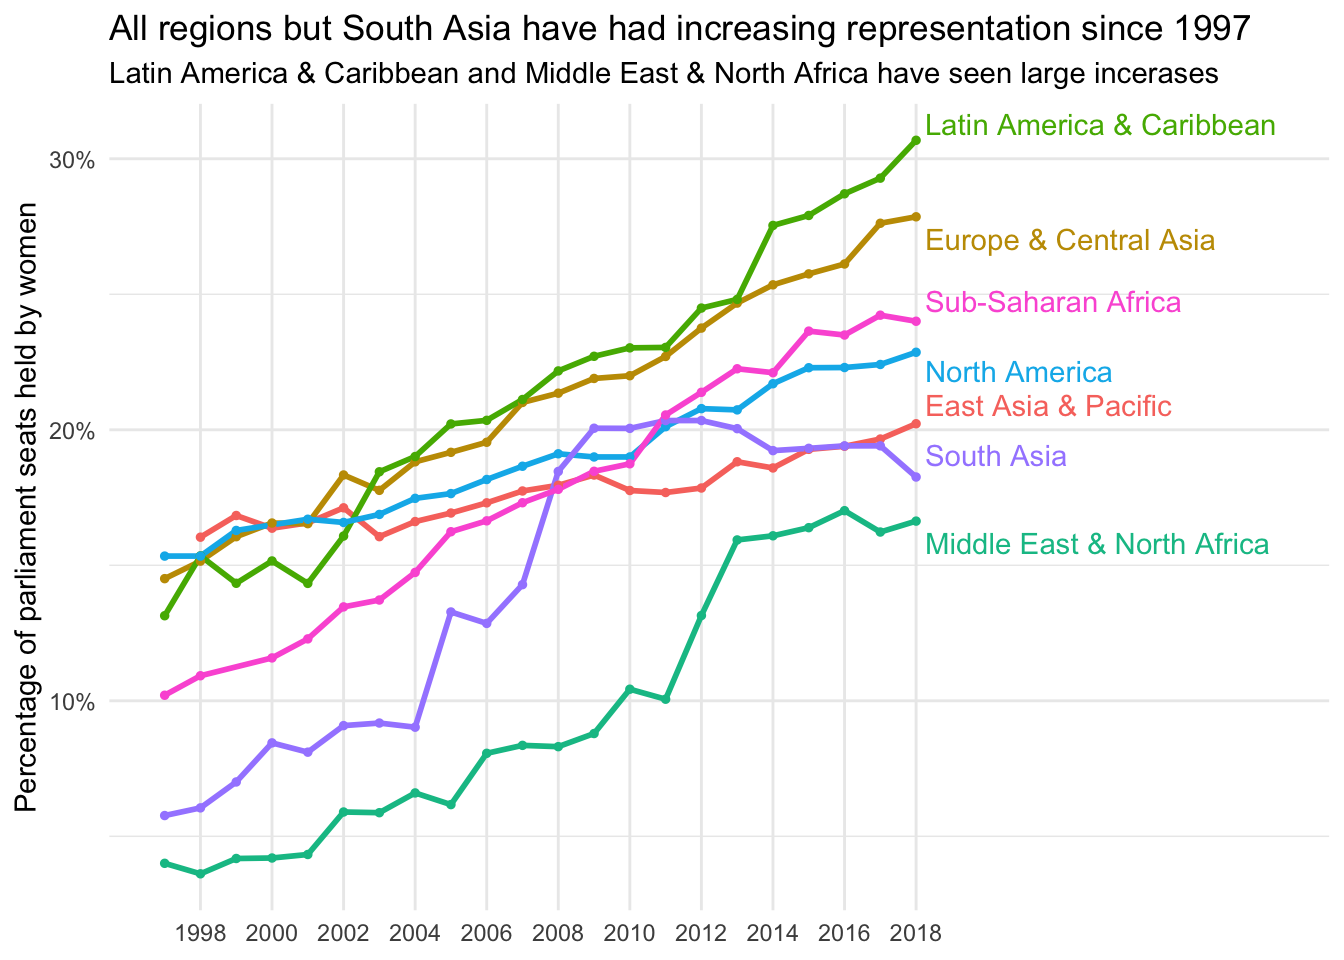
Notably, Latin America & the Caribbean went from the fourth leading region in terms of female representation in the late 1990s to the leading region by a relatively significant margin by 2014. The Middle East & North Africa, though still lagging behind the rest of the world, also has experienced a marked increase since 1997. Interestingly, South Asia is the only region that has shown a decrease, with representation plateauing in 2009, and then beginning to decrease.
By income level
Another interesting aggregation is by income level of the countries.
order <-
  c(
    "High income",
    "Upper middle income",
    "Middle income",
    "Lower middle income",
    "Low income"
  )

wip %>%
  filter(country_name %in% order) %>%
  mutate(country_name = factor(country_name, levels = order, ordered = TRUE)) %>%
  drop_na(prop_women_seats) %>%
  ggplot(aes(year, prop_women_seats, color = country_name)) +
  geom_line(aes(group = country_name), color = "white", size = 2) +
  geom_point(aes(group = country_name), color = "white", size = 1) +
  geom_point(size = 1) +
  geom_line(size = 1) +
  ggrepel::geom_text_repel(
    aes(label = country_name),
    data = . %>% group_by(country_name) %>% top_n(1, wt = year),
    nudge_x = 0.25,
    direction = "y",
    hjust = 0,
    color = "grey30"
  ) +
  scale_x_continuous(
    breaks = seq(1998, 2018, 2),
    minor_breaks = NULL,
    limits = c(1997, 2025)
  ) +
  scale_y_continuous(labels = scales::percent_format(accuracy = 1, scale = 1)) +
  guides(color = "none") +
  theme_minimal() +
  labs(
    title = "Low income countries outperform lower middle income countries",
    x = NULL,
    y = "Percentage of parliament seats held by women"
  )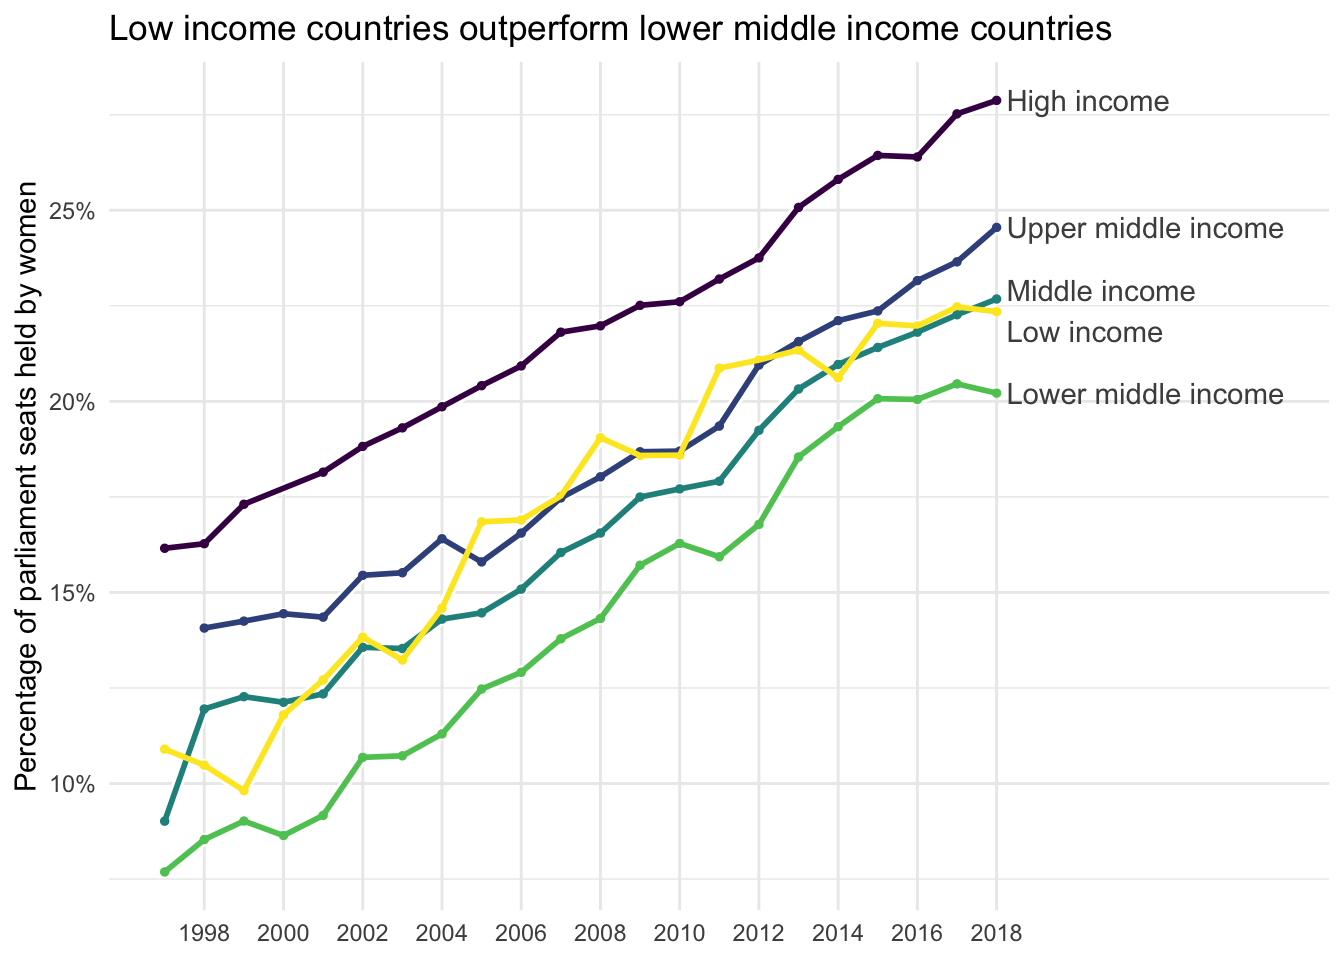
Unsurprisingly, based on the previous two plots, representation is increasing over time at all income levels. There is something very striking about this plot, though. Representation has been higher with higher income, with the obvious exception of low income regions. Representation in low income regions has been higher than in lower middle income regions every year recorded, and in three different years has been second only to high income regions.
By country
It is really difficult to look at the trend of all nations at once, given how many there are. We can visualize the most recent data across the globe by looking at a map of the world with data from 2018.
midpoint <-
  wip %>%
  filter(year == 2018) %>%
  semi_join(world %>% select(country_code = iso_a3)) %>%
  summarize(median_prop_women = median(prop_women_seats, na.rm = TRUE)) %>%
  pull(median_prop_women)
## Joining, by = "country_code"world %>%
left_join(
wip %>% filter(year == 2018),
by = c("iso_a3" = "country_code")
) %>%
ggplot() +
geom_sf(
aes(fill = prop_women_seats),
color = "grey20",
size = 0.1
) +
scale_fill_gradient(
low = "white",
high = "#01665e",
labels = scales::percent_format(accuracy = 1, scale = 1)
) +
coord_sf(datum = NA) +
guides(
fill =
guide_colorbar(
barwidth = 8,
barheight = 0.5
)
) +
theme_void() +
theme(
legend.position = "top",
legend.title.align = 1
) +
labs(fill = "Proportion of seats\nheld by women")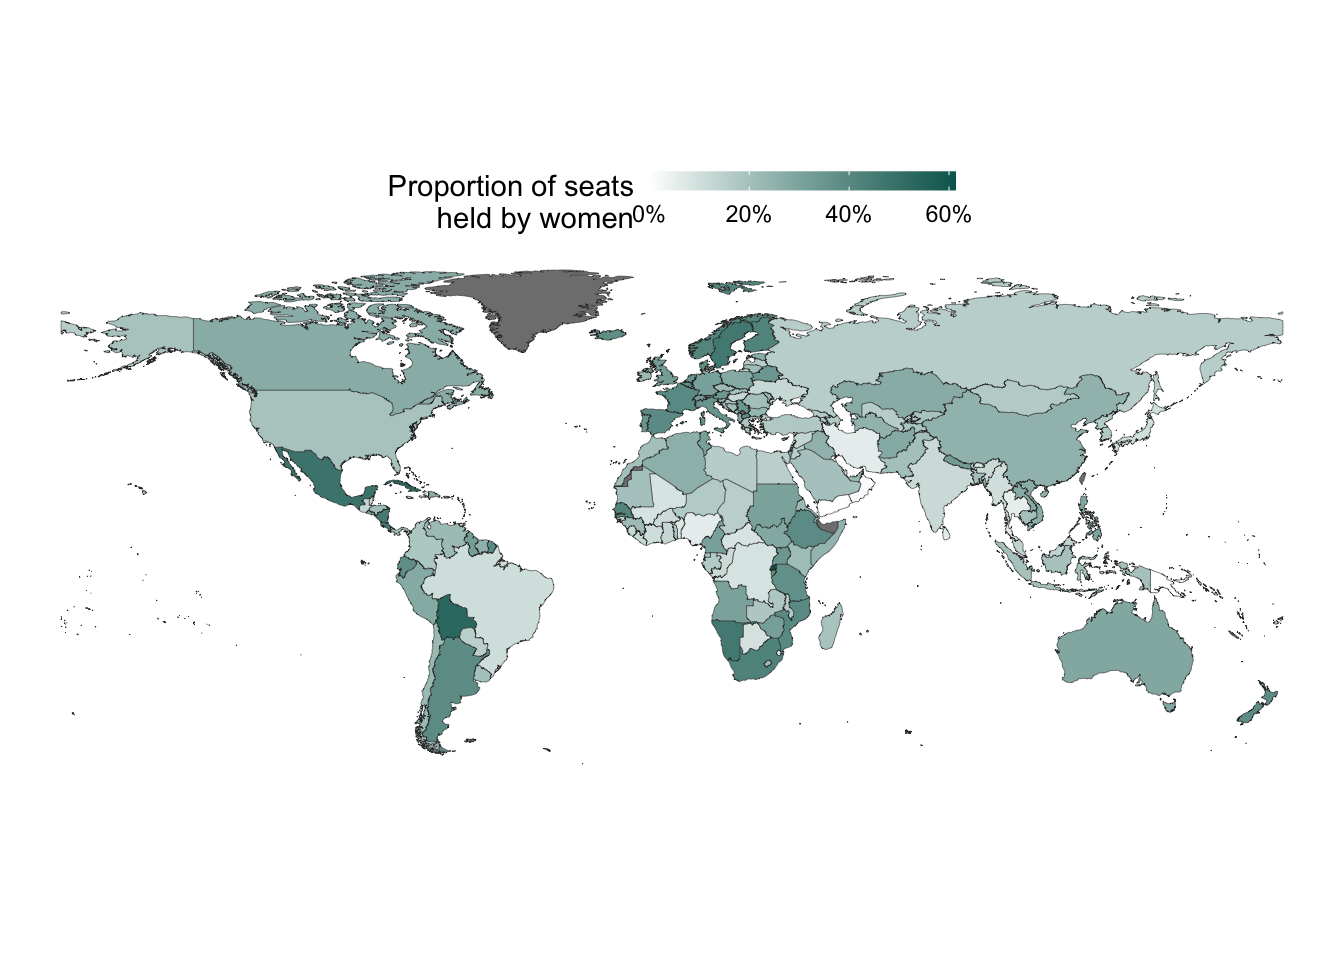
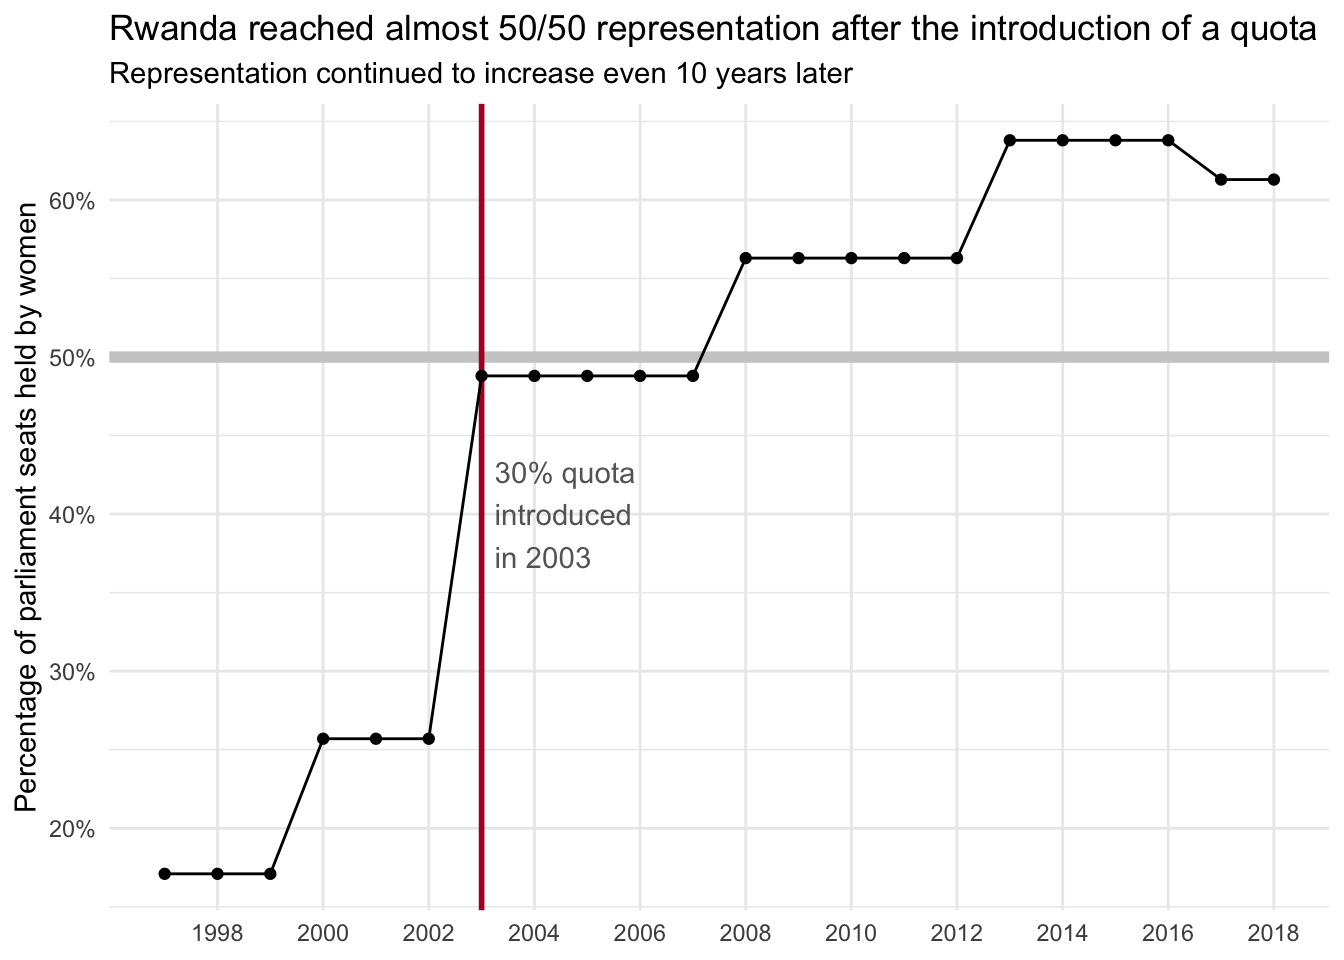
Case study: Rwanda
Though it’s hard to see from the map, at the very beginning we noticed that Rwanda had the highest female representation in its parliament in 2018, at over 60%! Looking into the politics there a bit more, I found that they introduced a quota system in 2003 that required 30% of the parliament to be made up of women. Looking at the data, there is a clear increase at the time this policy began.
wip %>%
  drop_na(prop_women_seats) %>%
  filter(country_name == "Rwanda") %>%
  ggplot(aes(year, prop_women_seats)) +
  geom_hline(yintercept = 50, size = 2, color = "grey80") +
  geom_vline(xintercept = 2003, size = 1, color = "#b2182b") +
  geom_line() +
  geom_point() +
  annotate(
    geom = "text",
    x = 2003.25,
    y = 40,
    label = "30% quota\nintroduced\nin 2003",
    hjust = 0,
    color = "grey40"
  ) +
  scale_x_continuous(
    breaks = seq(1998, 2018, 2),
    minor_breaks = NULL
  ) +
  scale_y_continuous(labels = scales::percent_format(accuracy = 1, scale = 1)) +
  theme_minimal() +
  labs(
    title = "Rwanda reached almost 50/50 representation after the introduction of a quota",
    subtitle = "Representation continued to increase even 10 years later",
    x = NULL,
    y = "Percentage of parliament seats held by women"
  )
Quota Systems
The case study of Rwanda made me think more about quotas: how effective are they? where have they been implemented? Conveniently, the Institute for Democracy and Electoral Assistance (IDEA) has a public dataset of the types of quotas implemented all over the world! The only downside is that the database doesn’t include the year the quota was introduced. This is something that could be collated manually but we can work without for now.
There are three types of “quotas” in the dataset, explicit quotas about the number or fraction of seats to be held by women, a reserved seats system where certain seats must be held by women, and voluntary systems where some parties elect to hold themselves to a quota but none exists in law. We can visualize how these systems are implemented around the world with a map.
type_order <-
  quotas %>%
  count(quota_type, sort = TRUE) %>%
  pull(quota_type)

world %>%
  left_join(
    quotas %>%
      mutate(
        quota_type = factor(
          quota_type,
          levels = type_order,
          ordered = TRUE
        )
      ),
    by = c("iso_a3" = "country_code")
  ) %>%
  ggplot() +
  geom_sf(aes(fill = quota_type), color = "white", size = 0.1) +
  scale_fill_brewer(
    type = "qual",
    palette = "Dark2",
    na.value = "grey80"
  ) +
  theme_minimal() +
  theme(legend.position = "top") +
  coord_sf(datum = NA) +
  labs(x = NULL, y = NULL, fill = "Quota Type")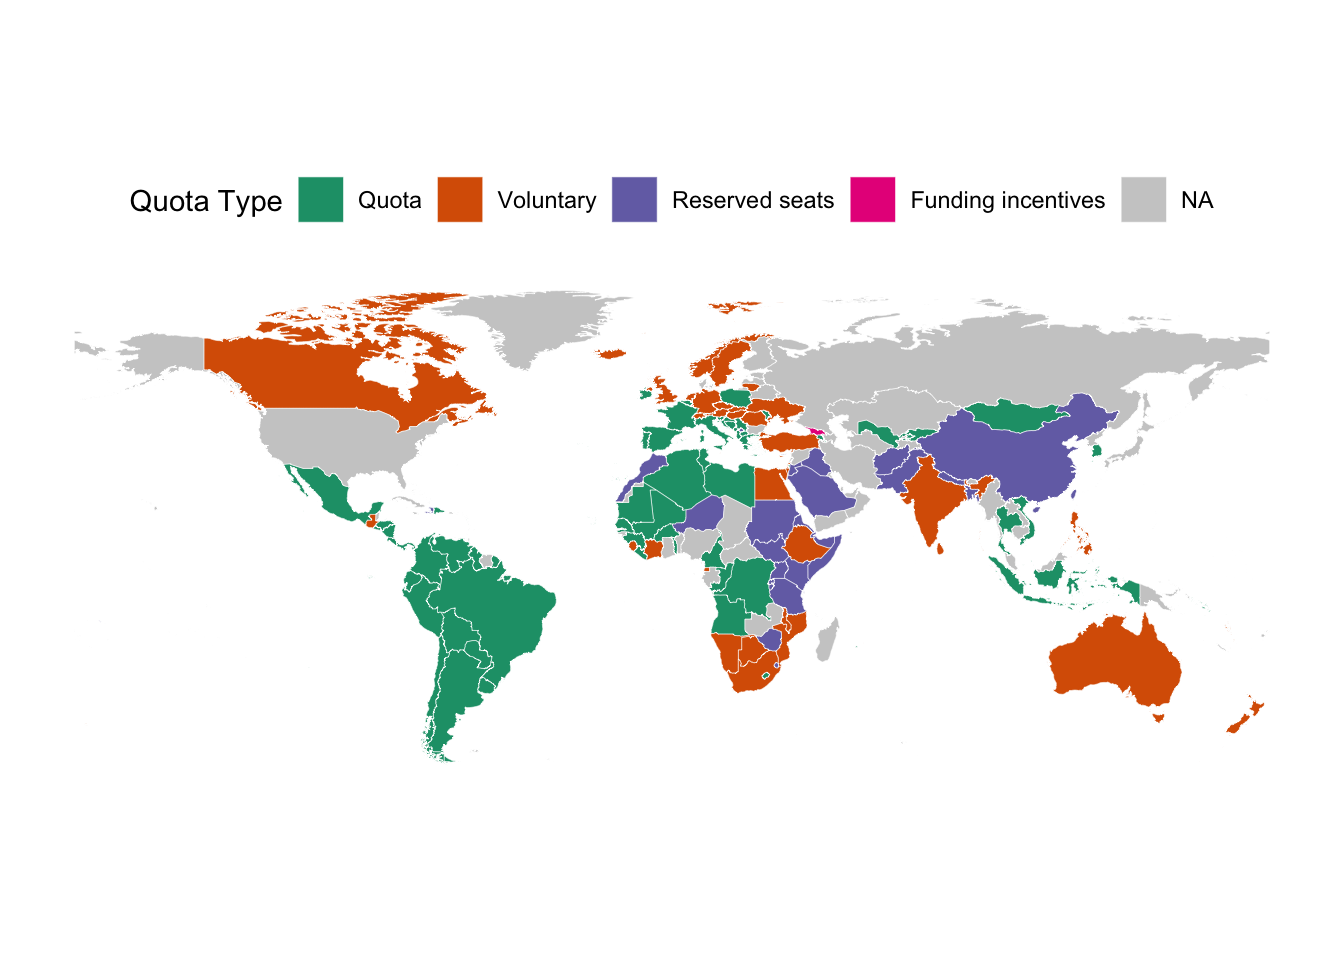
We can see that South & Central America have almost completely adopted quotas. As we noticed above, this region has had particularly notable improvement in female representation since 1997.
Now to make any causal claims about quotas and representation trends would need much more careful analysis, so I should emphasize I am not trying to do that. There are a couple of simple questions we could answer with this data, though.
- Do the countries with the biggest increase in representation from 1997 to 2018 also have quota systems in place?
differences <-
  wip_quotas %>%
  filter(year %in% c(1997, 2018)) %>%
  spread(key = year, value = prop_women_seats) %>%
  mutate(
    difference = `2018` - `1997`,
    quota_type = if_else(is.na(quota_type), "None", quota_type)
  ) %>%
  drop_na(difference)

differences %>%
  top_n(n = 10, wt = difference) %>%
  arrange(desc(difference)) %>%
  select(country_name, quota_type, difference) %>%
knitr::kable(caption = "The countries with the biggest increase in percentage of parliament seats held by women from 1997 to 2018")| country_name | quota_type | difference |
|---|---|---|
| Rwanda | Reserved seats | 44.2 |
| Ethiopia | Voluntary | 36.8 |
| North Macedonia | Quota | 35.0 |
| Nicaragua | Quota | 34.9 |
| Ecuador | Quota | 34.3 |
| Mexico | Quota | 34.0 |
| Cuba | None | 30.4 |
| Senegal | Quota | 30.1 |
| Costa Rica | Quota | 29.8 |
| Nepal | Reserved seats | 29.3 |
In fact only two of the top 10 countries by increase 1997-2018 did not have some form of legally binding quota system in place.
- Did countries with quota systems in place see larger year-to-year jumps than those without?
largest_jumps <-
  wip_quotas %>%
  group_by(country_code) %>%
  arrange(year) %>%
  mutate(
    jump = lag(prop_women_seats) - prop_women_seats,
    quota_type = if_else(is.na(quota_type), "None", quota_type)
  ) %>%
  drop_na(jump) %>%
  summarize(
    largest_jump = max(jump),
    quota_type = first(quota_type)
  ) %>%
  filter(
    quota_type != "Funding incentives" # only one country
  )
## `summarise()` ungrouping output (override with `.groups` argument)median_largest_jump <-
largest_jumps %>%
summarize(med = median(largest_jump)) %>%
pull(med)
largest_jumps %>%
ggplot(aes(quota_type, largest_jump)) +
geom_hline(yintercept = median_largest_jump, size = 2, color = "white") +
geom_violin(draw_quantiles = 0.5) +
scale_y_continuous(labels = scales::percent_format(accuracy = 1, scale = 1)) +
labs(
x = "Quota type",
y = "Largest one-year jump in female representation from 1997 to 2018",
title = "More countries with quota systems saw large year-to-year jumps\nin female representation",
subtitle = "Though some very large jumps occurred in countries without quotas"
)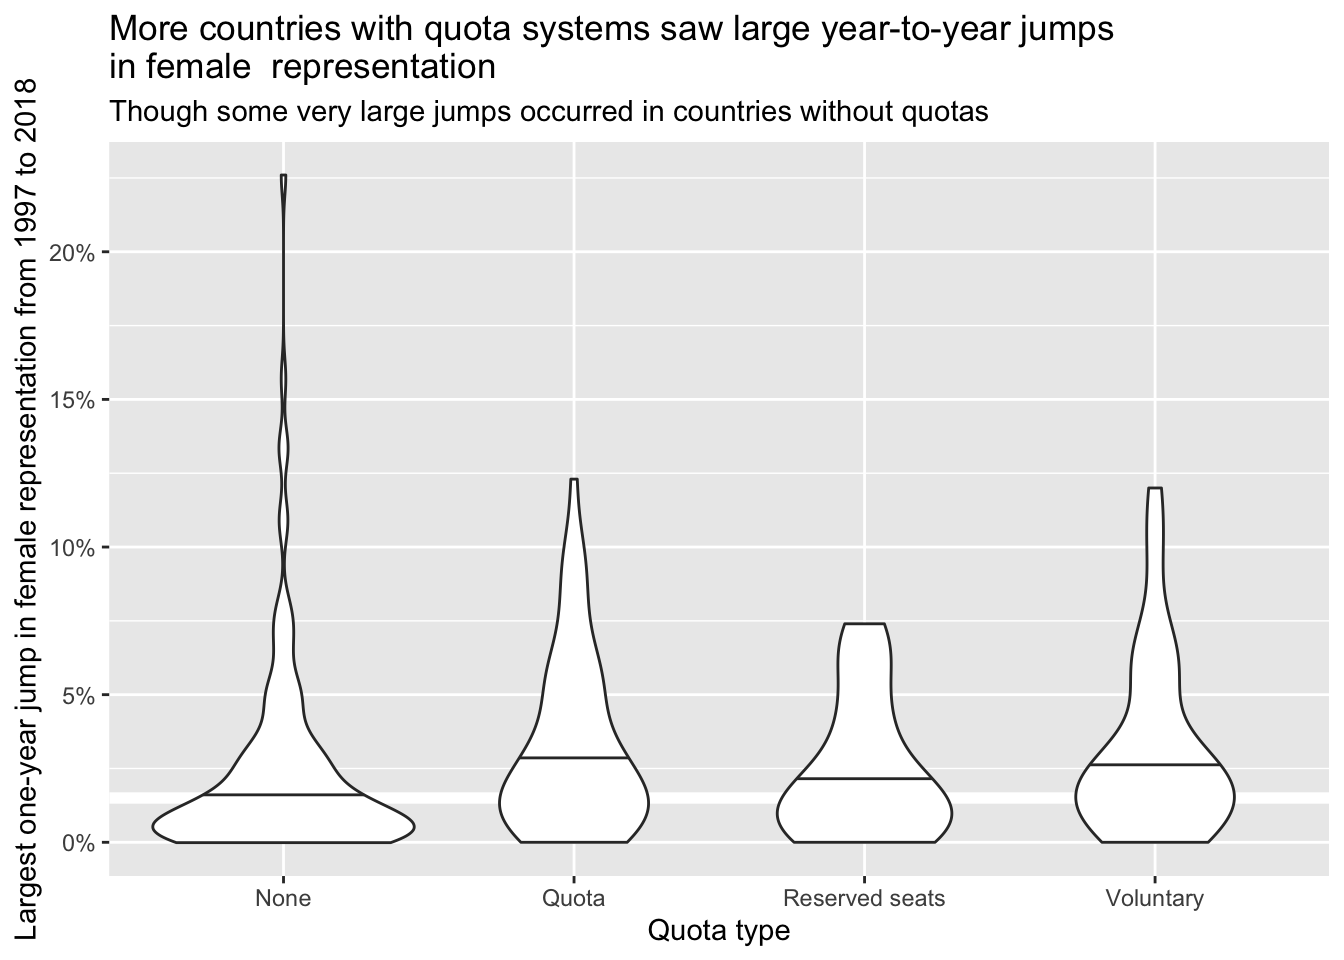
To make this plot, I calculated the largest jump in percentage of seats held by women from one year to the next for each country. The distribution of these jumps by quota system is then plotted as a violin plot. The white reference line shows the median largest jump size across all countries. Each line within a violin plot shows the median largest jump size for countries with that type of quota system in place.
Two things are clear:
- More than 50% of countries with some kind of quota system experienced a larger jump than the median largest jump in countries with no quota system at all.
- Some countries with no quota system experienced extremely large jumps from one year to the next. Clearly quotas are not necessary to achieve this.
- Side note: since I was curious, I looked up that enormous outlier. It’s Andorra and they had an election in 2011 where 15 women were elected making them the first country in Europe to have a majority female parliament.
Like I said before, I am being careful not to make any causal claims here. Clearly, representation can be increased with or without quotas. Exploring these datasets has been lots of fun, and there are definitely some very positive examples that give hope for a more equal future!